Balanced (accumulation)

Balanced (accumulation)

Overview

Objective


To provide a diversified portfolio that has an appropriate balance between income and capital growth investments with medium to high levels of risk.

The Fund aims to achieve returns 3.25% above inflation1 after investment fees and taxes over a 10 year period.

1 The measure of inflation is the Consumer Price Index (Trimmed mean) released by the Australian Bureau of Statistics on a quarterly basis.


Minimum investment timeframe

8 years

Risk level

Medium to high

Investors that the Fund may suit

Members comfortable with a medium to high level of risk that have an investment timeframe horizon of at least 8 years


Asset allocation

Performance

Balanced (accumulation) 5.5% 6.8% 6.6% 7.2% 7.0% 9.9% 9.1% 2.4% 2.6%
6.4%
(31 Dec 1998)
Compare the options

Fees

We may not always be the cheapest, but we believe we provide good value for what we offer. We have a unique purpose and vision – to invest for a better world, where money is a force for good.

Ethical first
Ethical first

Ethical investing has been our core business since 1986. Our comprehensive ethical investment process restricts+ investments in negative activities like fossil fuels, nuclear, tobacco, and support positive ones in renewables, healthcare, IT and more.

Make money and a difference

We also leverage our position and our brand to agitate and influence companies we invest in, the economy and society, and catalyse positive change for people, planet and animals.

Long-term track record you can love

While we can’t predict future performance, our award-winning# team, backed by years of experience, is dedicated to delivering strong* returns for our Super members.

Annual fees for Balanced (Accumulation) on a $50k balance

Before tax rebate:

$198

Admin fees
$68 & 0.26% p.a

+

$405

Investment fees & costs
0.81% p.a

+

$15

Transaction costs
0.03% p.a

=

$618

Total fees & costs
~1.24% of balance


After tax rebate:

$168

Admin fees
$57.8 & 0.22% p.a

+

$357

Investment fees & costs
0.71% p.a

+

$15

Transaction costs
0.03% p.a

=

$540

Total fees & costs
~1.08% of balance


This is an example of the ongoing annual fees and costs for this option over a one-year period. Additional fees and costs may apply. Exit fees do not apply. Read our Super Product Disclosure Statement (PDS) for more details.

Sustainability indicators

Our ethical investment approach favours companies and portfolios with stronger sustainability characteristics. The sustainability indicators presented below are for the investment by this option in listed shares at 30 June 2024 for which we have relevant sustainability data.

These listed shares are 56% of total investments of this option, and the indicators are not applicable to the other investments of the option.

75% less carbon intensive

75% less carbon intensive

The carbon intensity (tonnes of CO2 equivalent per dollar company revenue) for our listed share investments at 30 June 2024 is 75% lower than a mainstream share market benchmark(1,2)

2.2x revenue in sustainable solutions

2.2x revenue in sustainable solutions

These listed companies earn 2.2 times the revenue from sustainable solutions at 30 June 2024 than a mainstream share market benchmark(1,3)

3.6x clean energy solutions

3.6x clean energy solutions

These listed share investments at 30 June 2024 have 3.6 times the investment in renewables and energy solutions than a mainstream share market benchmark(1,3)

Sustainable Solutions Revenue Breakdown

Below is the estimated annual revenue earned by these listed companies that has been identified as contributing to sustainability goals such as the Sustainable Development Goals. The Sustainable Development Goals were set by the United Nations as a blueprint on how to achieve a better and more sustainable future. Find out more at sdgs.un.org/goals.

This is a general indication only and relates only to 56% of the investments of this option. The revenue is calculated per $1M invested in these listed shares and based on shareholdings at 30 June 2024.

This information is of a general nature and is not intended to provide you with financial advice or take into account your personal objectives, financial situation or needs. The sustainability characteristics of companies we invest in is not a measure of the impact of your investment. Your investment decisions should take into account the financial, risk, fee and other characteristics of potential investments.

This information is only shown for those listed shares where we have the necessary sustainability data. The comparisons are with available data for shares in a general share market benchmark selected as an appropriate investment benchmark ("Benchmark shares").

There is more information about the calculation method and benchmark here

Case studies

We know it can be difficult to imagine the real world impact that your super has. Explore the case studies below to learn more about some of the companies we're invested in.

CaseStudy_Meridian-Thumb-1723604321816.jpg
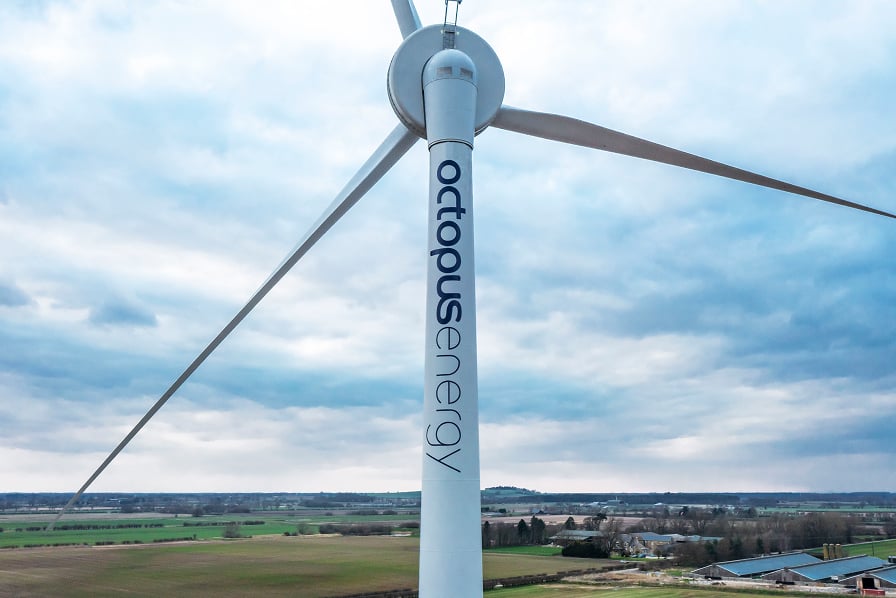
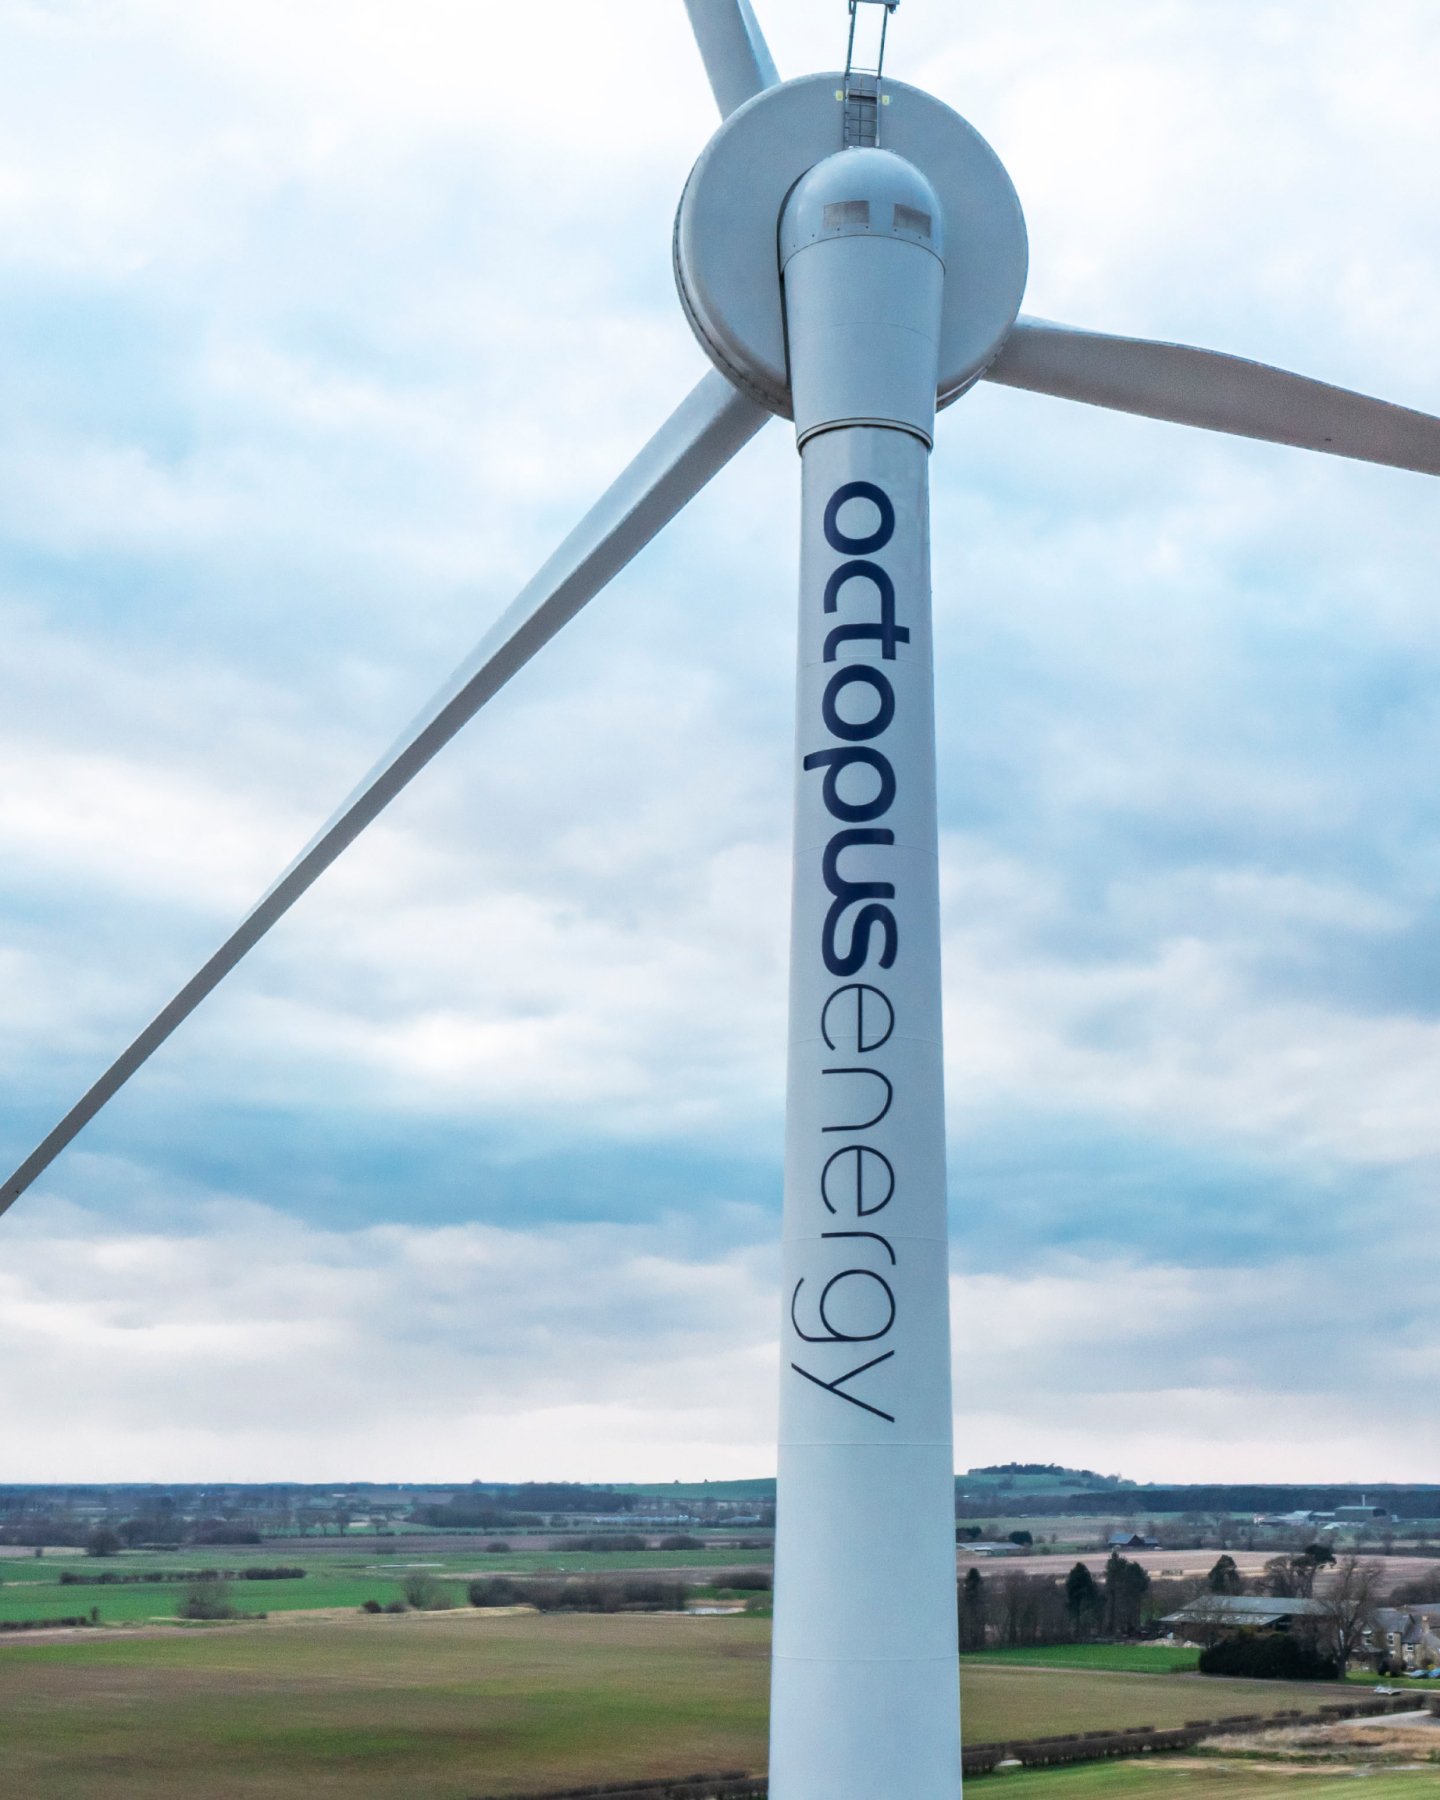
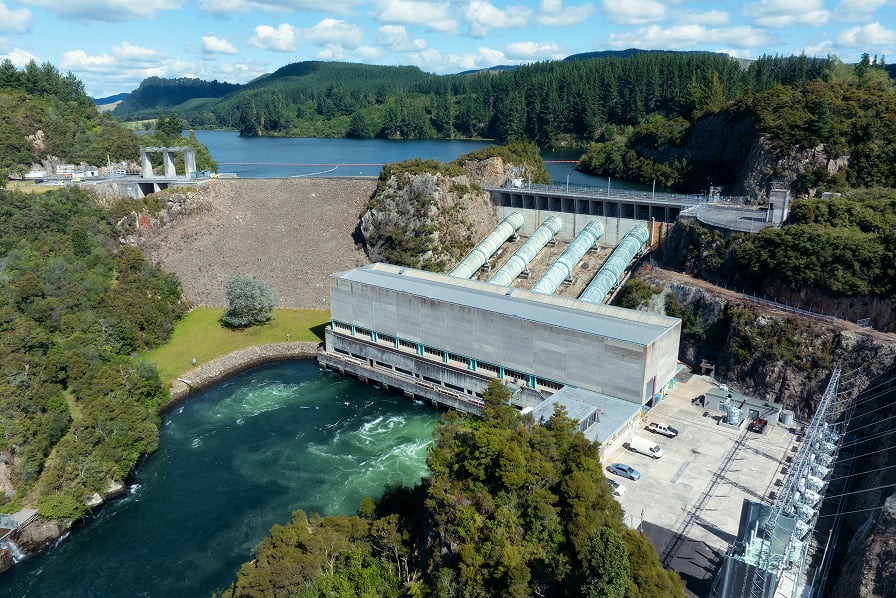
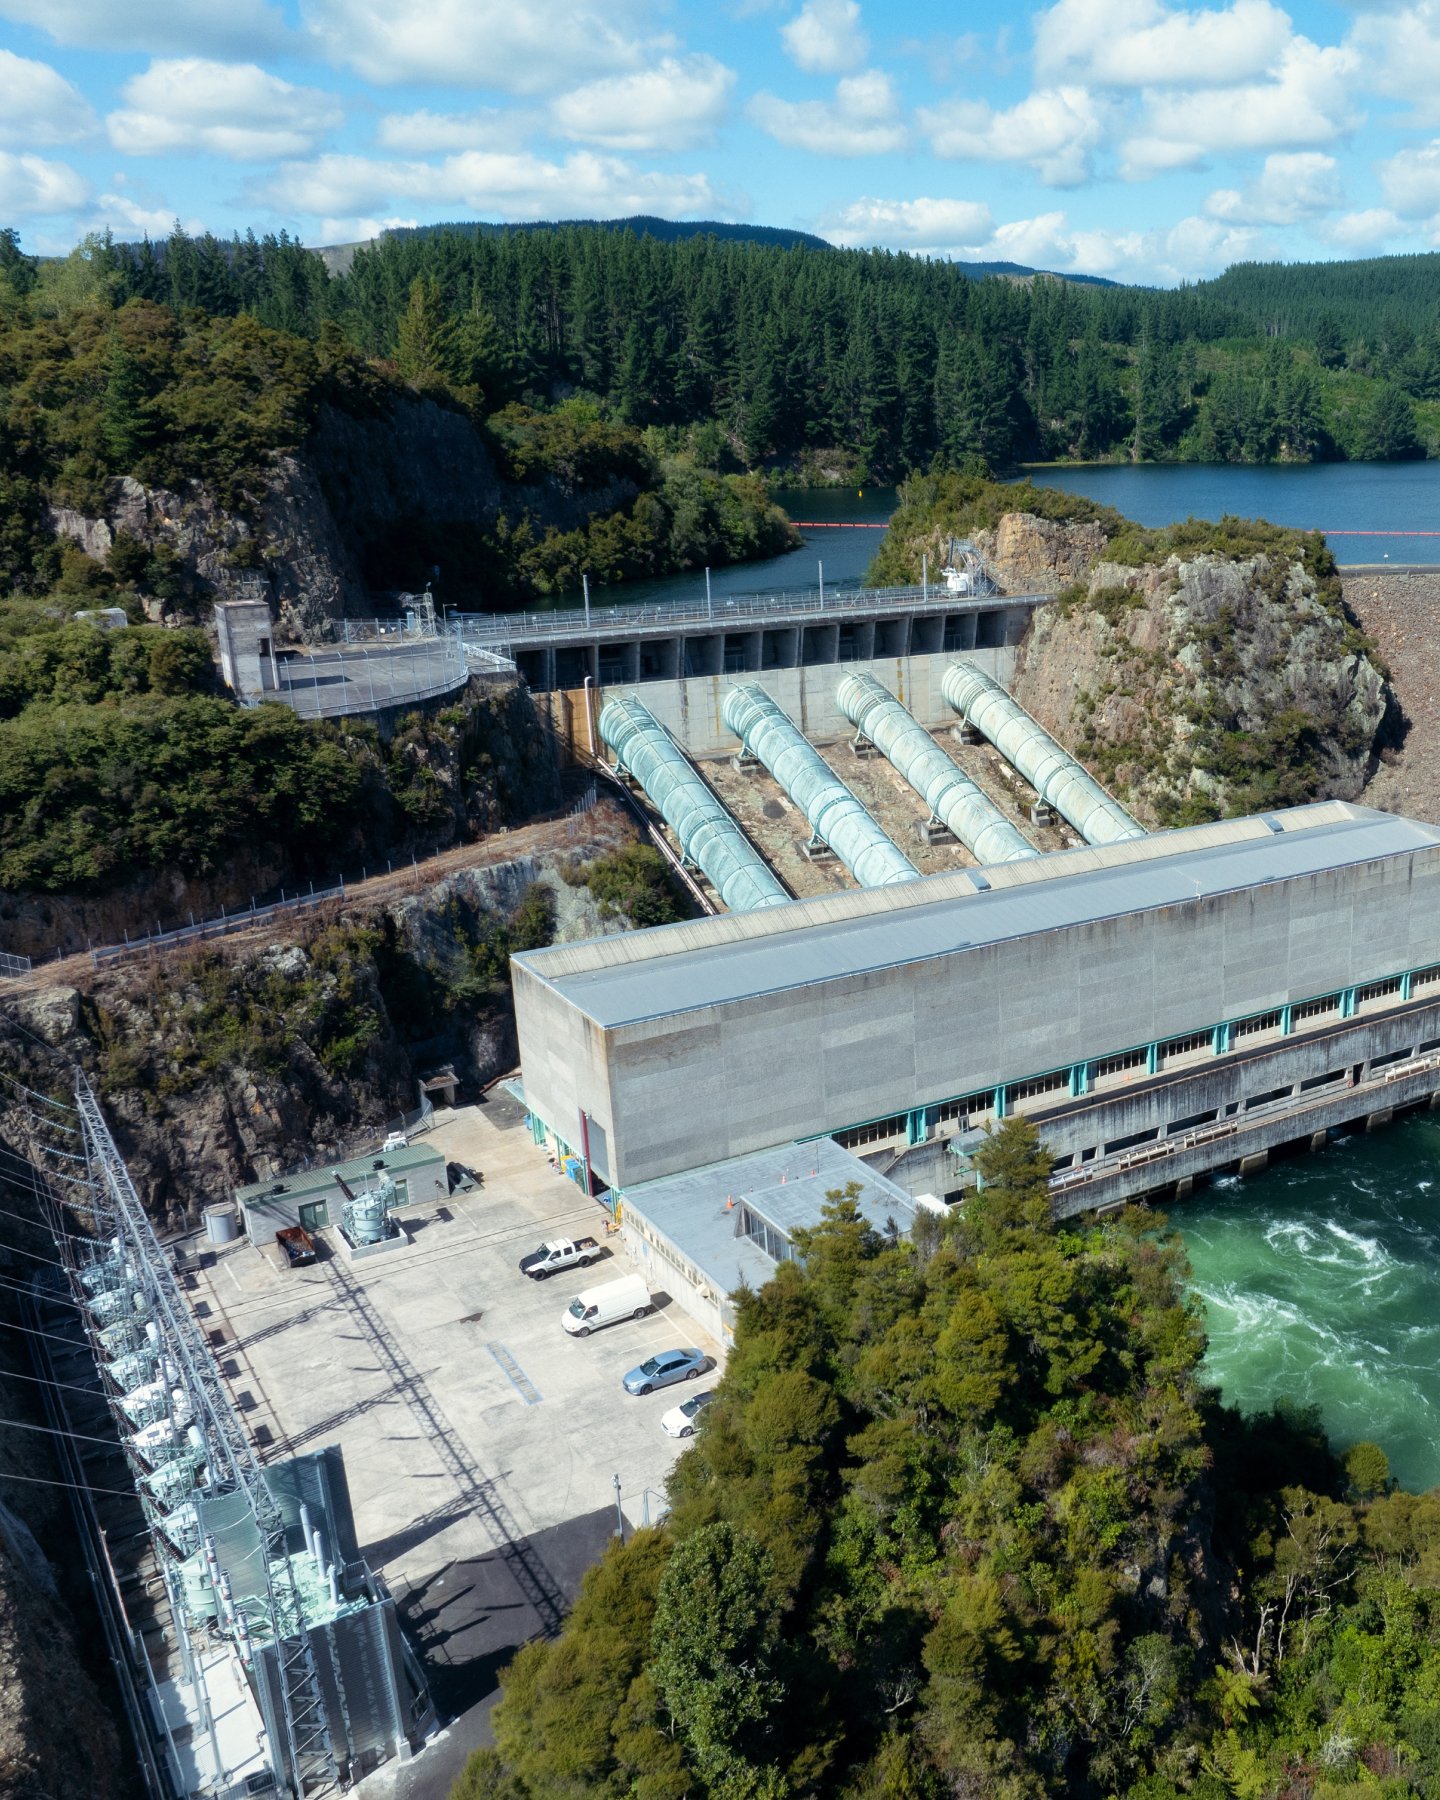
Meridian Energy
Meridian Energy generates, trades and retails electricity from renewable energy sources such as wind and hydro power.
CaseStudy_MainSequence-Thumb-1723604322831.jpg
Main Sequence CSIRO
Main Sequence is a deep tech venture capital fund focused on tackling the world’s biggest challenges by turning scientific discoveries into future industries.
CaseStudy_Cochlear-Thumb-1723604318420.jpg
Cochlear
Cochlear provides bone conduction implants for people with conductive hearing loss, mixed hearing loss and single-sided deafness.

More information

Invest with heart

Join now
  1. Compared to a general share market benchmark selected as an appropriate investment benchmark for this option or fund, and based on shareholdings at 30 June 2024 and analysis tools provided by external sources accessed on 03 July 2024. More details here.

  2. Carbon intensity (tonnes CO2e/A$M revenue) of the listed companies is calculated as this option or fund's share of annual carbon emissions of the companies (including their scope 1 and scope 2 emissions), divided by this option or fund's share of annual revenue earned by those companies. More details here.

  3. Based on the revenue from sustainable impact solutions earned by the listed companies and the proportion of the listed share investments in renewables and energy solutions. Sustainable impact criteria and data is provided by external sources and aims to measure revenue exposure to sustainable impact solutions and support actionable thematic allocations in line with the U.N. Sustainable Development Goals (SDGs), EU Taxonomy of Sustainable Activities, and other sustainability related frameworks. More details here.

Australian Ethical offices are located on the lands of the Gadigal and Wurundjeri People.
Australian Ethical acknowledges the Traditional Owners of the countries on which we work, and recognise and celebrate their continuing connection to land, waters and culture. We pay our respects to Elders past and present and thank them for protecting Country since time immemorial.

See our Reconciliation Action Plan